
This post is inspired by three interesting statements or questions that I heard and are interconnected by non-obvious theory:
First was regarding so called checkerboard rendering (example1 example2) – what is advantage of using it? After all it’s the same as rotating your grid by 45 degrees? Presentations on it claim better PSNR, but why?
Second one was regarding reconstruction filters. Why all classic interpolation kernels “separable”, applied separately on x and y sequentially and not being rotationally symmetrical?
Finally third one is something I often hear as a question – why are MSAA patterns like a 4x quad rotated diagonally?
I am going to try to introduce some theory first and show how it all relates to representable frequencies and aliasing. This post is accompanied by two shadertoys: one and two.
1D Sampling recap
Single dimensional signal sampling is well understood and taught in any signal processing course. In most basic words it is process when you take series of single measurements of some continuous process and every measurement is same distance apart. As long as your source signal has no frequency content higher than half of the sampling frequency (Nyquist-Shannon limit) and you use impractically perfect reconstruction filter, you can reconstruct back the original signal.
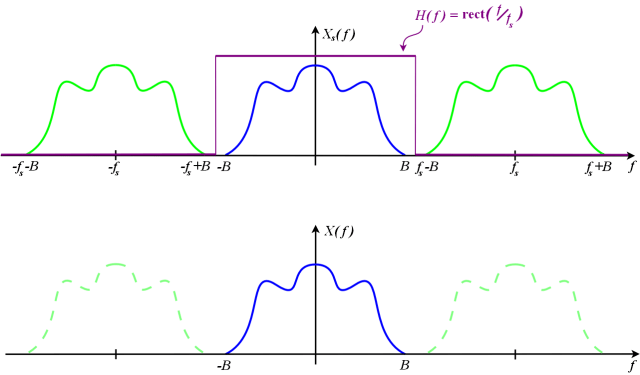
Signal containing frequencies Nyquist limit can be reconstructed faithfully under perfect reconstruction filter. Source: Wikipedia.
If your signal contains higher frequencies, they are going to start to alias – manifest themselves as lower frequencies, mixing with existing frequency content and corrupting the signal measurements. In other words, frequencies beyond Nyquist rate are equivalent to lower frequencies under sampling.

Two frequencies can alias under inadequate sampling rate. Source: wikipedia.
2D Sampling
This is where things start to be less covered by literature and more interesting. Process of 2D sampling is process of a series of sequentially performing two 1D sampling operations on two different axes (sampling is separable!).
In the first step we sample a bivariate continuous signal into discrete series (for example in X dimension) of continuous 1D signals (in Y direction) and then sample them again in Y dimension to get a grid of discrete samples. Pixels are not little squares (famous article by Alby Ray Smith). They are grids of samples.
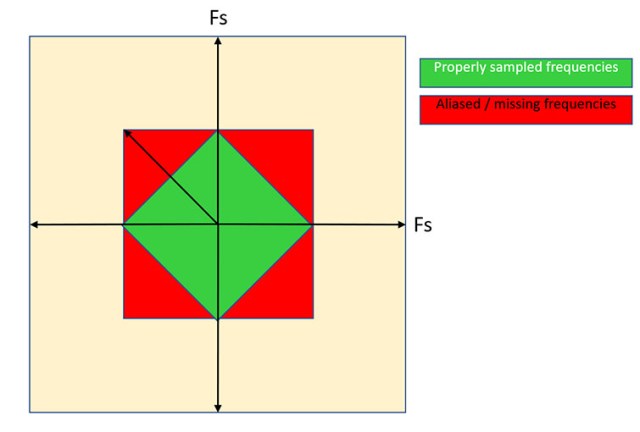
However if you now look at consequences of Nyquist-Shannon theorem of two consecutive sampling operations, you will see that representable frequencies form a box:

Most readers have probably seen this type of diagram many times – but I marked there something interesting and non-obvious. If you think about a rectangular Nyquist domain, in diagonal direction higher frequencies (sqrt(2) times higher) can be represented!
This means that lines, triangles and generally features aligned with X or Y axes (or near to them) will alias faster than the ones that are diagonal.
Zone plate and Siemens star
We can see this effect easily in any pattern designed to represent multiple frequencies.
Two commonly used ones are a zone plate and Siemens star.
Side note: I have no idea why they are not used more commonly by real time graphics rendering community when talking about anti-aliasing or post-processing. Much easier to test quality of your algorithms on known all-frequency pattern than just eyeballing on arbitrary content.
This is a zone plate variant:

Variant of a zone plate.
And this is a Siemens star variant:

Variant of Siemens star (animated).
Both are supposed to capture variety of frequencies in a single image.
On both images, when frequencies increase (uniform / isotropic frequency change), on principal X / Y axes you can see aliasing or failed reconstruction artifacts appear much faster! Especially in motion, here magnified the issue on a static image:
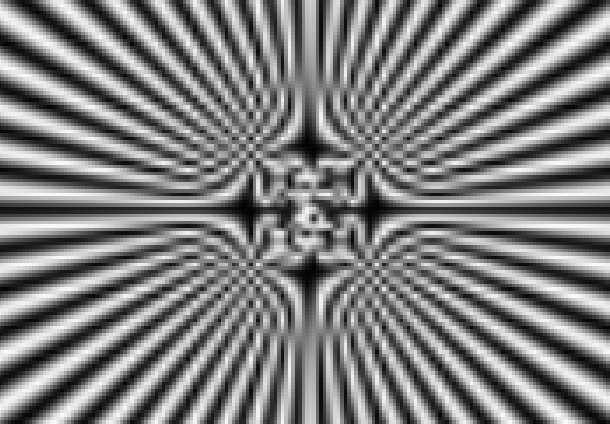
Cropped and nearest-neighbor magnified center of Siemens star – notice non-isotropic and non radially symmetric behavior.
Main axes exhibit much stronger aliasing and the appearance of “wrong” frequencies earlier.
Frequency spectrum of a grid being a box answers one of questions – most reconstruction and resampling filters are specified only in a single axis and interpolation is done independently. Why? Goal of interpolation and reconstruction is to remove any frequencies that cannot be represented before they alias (and not remove other ones) and any frequency cutoff will happen much more on those axes where aliasing will happen first.
Rotating the grid
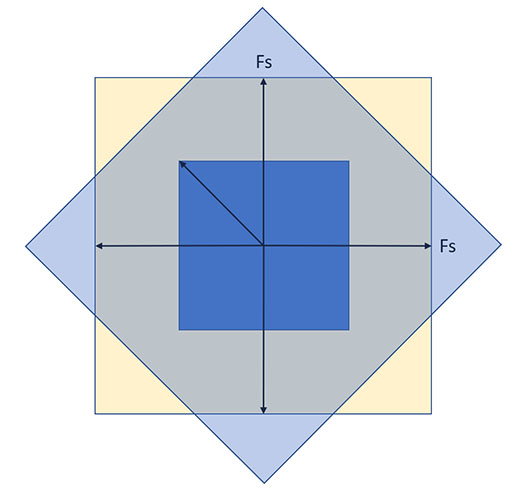
Immediate question that arises would be – what would happen when you rotate your pixel grid by some angle, let’s say for simplicity of analysis 45 degree keeping the same sampling density?
By just rotating the area of represented spectrum cannot change – so we are guaranteed that we will gain some frequencies and lose some other ones. In this case we can get better axis aligned representation at the trade-off of more aliased diagonals. This would sound like a potentially attractive trade-off in some context (e.g. architecture or urban rendering), but rotated signal cannot be displayed on an axis-aligned grid screen. It has to be resampled and perfect resampling filters are impractical (large spatial support, potential for ringing of aliased content or noise), so we’d need to lose even more resolution and not filter out perfectly.
It’s not a great option and assuming this 1-1 ratio it’s not surprising that it’s not used in practice (at least I haven’t heard of – let me know in comments!).
But we can take advantage of rotating sampling patterns in different contexts!
Checkerboard rendering
Checkerboard rendering is a form of mixed resolution rendering. Goal here is to be able to reconstruct a full resolution (for example full 4K resolution like in PlayStation 4 Pro) signal from undersampled one. No decimation / removing frequencies should take place if possible. Obviously we cannot make up for what was missing in the first place without using other techniques like temporal supersampling (we can only hallucinate it), but at least we’d want to not have aliasing.
Checkerboard rendering tries to answer a question: how can you optimally render the image given just 50% of computational power?
(I know, concept of “optimally” is a whole topic of its own – what does it mean? but let’s assume most detailed and least aliased).
Uniform rescaling
One option is to render in uniformly rescaled resolution (both dimensions scaled by sqrt(2).
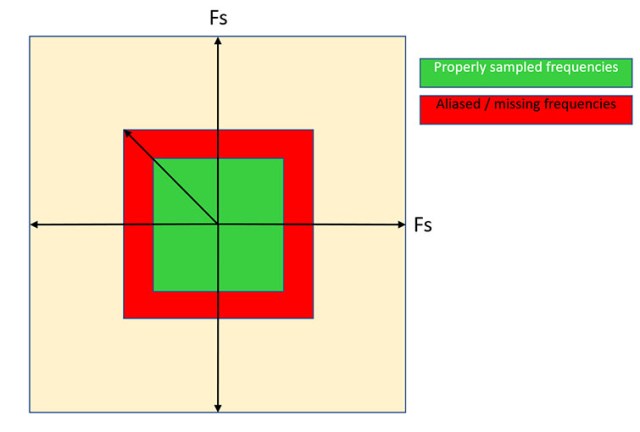
This means that we get uniform detail loss and aliasing in each direction. Vertical and horizontal directions will be even less represented than in our original grid, while we still have potential for expressing higher spatial resolution of diagonal edges.
Biggest issue with uniform rescaling is a need for very high quality reconstruction / resampling filter. Without it upscaling to native (ex. 4K) resolution can result in even more detail loss and aliasing.
Second problem is that no frequencies get fully represented and all content rendered in this lower resolution and resampled will look worse.
Interlaced rendering
Another option would be to just do form of interlaced rendering – so rendering one of dimensions in half resolution. It is a very attractive option as then reconstruction filter can be only 1D, which means better efficiency. We can even go with a very expensive reconstruction filter in that dimension (like a wide support windowed sinc).

While it is cheap, it is also on its not great for rendering quality (under assumption of no temporal antialiasing / extra supersampling). It means that while in one direction edges will be represented as good as with full resolution rendering, in other directions they will be 2x more aliased and with 2x more detail loss.
On the other non-rescaled direction will not suffer from any aliasing from resampling / reconstruction.
Checkerboarded rendering
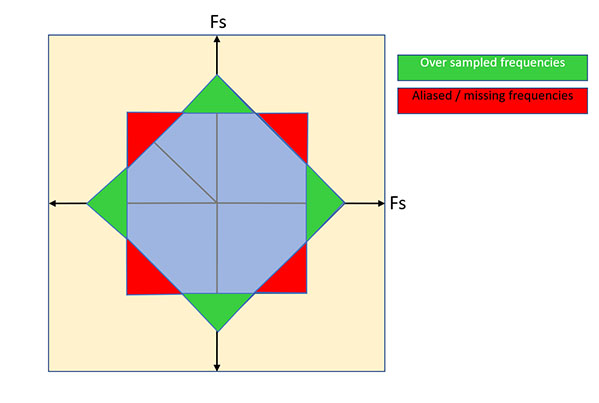
Finally, there is an option (with some special hardware sauce of adjusting sample positions in a quad plus some others) of doing checkerboarded rendering, so shifting every other row by half. This results in a rotated grid. How well does it perform?
Checkerboarded rendering allows us to represent horizontal and vertical edges as well as full native resolution! Under perfect reconstruction there would be no detail loss there. Frequencies suffering the most are the diagonals, they will be 2x undersampled compared to native resolution (but only sqrt(2) / 2 worse than horizontal / vertical).
Checkerboarded rendering needs a high quality reconstruction filter for it to hold, but even with a naive bilinear filling of missing samples it can look ok.
Compared / together
From Fourier domain perspective, checkerboard rendering looks very attractive. How does it perform in practice? I created a very simple shadertoy demo comparing those methods on a zone plate. Note: it uses most crude reconstruction possible (tent/bilinear).
When using this simple bilinear filters in my opinion checkerboard rendering looks the best (obviously after the full resolution) and only aliasing happens around the main diagonal.
Anti-aliasing rotated grid patterns
Another common use of rotated grids for different frequency aliasing is either super-sampling or hardware-accelerated techniques like MSAA. Goal of such variants or anti-aliasing is to sample at higher frequencies, avoiding aliasing (avoid high frequencies folding over as low frequencies) and before display use a reconstruction filter that will remove them prior to resolving onto final sampling grid.
As resampling/filtering (signal decimation) will happen anyway, we are free to chose any sample position.
Assuming 4x supersampling / MSAA two alternatives that we will consider here is just axis-aligned box and 45 degree rotated box and 4 samples.

If we sample 4x with an uniform grid, we get uniformly 2x more non-aliased frequencies.
If we decide to use rotated grid 4x pattern, we get 4x larger rotated box. This one is a bit different. We get a lot more horizontal and vertical anti-aliasing and a bit more diagonal anti-aliasing. Near horizontal and near vertical lines will observe a massive improvement (2*sqrt(2)) and diagonals will observe some / medium improvement (sqrt(2)).
Using rotated grid gives us better representation of horizontal/vertical signal frequencies and smaller gain in diagonal ones.
Side note: this matters mostly when using a very cheap decimation filter like a box filter (for a long time commonly used as MSAA resolve…) that aliases a lot of frequencies around Nyquist – on principal directions it’s lower so it is preferred to not have any corrupted / aliased frequencies there.
In hardware (MSAA)
Interestingly, by default hardware 4x MSAA patterns are neither axis-aligned nor 45 degree rotated (for example in DirectX 11). They are not horizontally/vertically symmetric.

Standard DirectX11 MSAA patterns. Source: MSDN documentation.
Since frequency spectrum will be unevenly rotated, frequency aliasing also will be uneven. So same a frequency rotated let’s say 15 degrees clockwise or counter-clockwise will get different amounts of aliasing. It is an interesting choice and I don’t know if there is a specific reason for it other than my guess “it’s good enough and integer offsets are hardware implementation friendly”.
Edit 05.17.2018: Sebastian Aaltonen wrote in comments the following great explanation of this pattern: N-rooks looks better than 45 degree rotated when you have lots of straight X/Y lines, such as walls/staircases/buildings, especially with box filter. Aligned lines are a common case in games as the camera up vector tends to be locked. When the building edge moves slowly across the pixel in X direction, you get four different blending values with N-rook pattern, while 45 deg rotated grid gives you only 3, and the middle one has 2x weight as the samples overlap. DirectX sampling pattern is as close to 45 degree rotation as you can get, while maintaining even spacing between the samples in both X and Y axis. It is a pretty good compromise for the worst case visible aliasing problem, which is straight lines slightly off X or Y axis.
Here is a shader-toy comparison of those methods (with a naive and suboptimal box filter).

The “ROTATE DX” corresponds to rotation like in DirectX documentation. You can see that more towards horizontal direction there are some more aliased frequencies.
I am not sure if this is very clear, but to me the rotation by 45 degree looks cleanest.
Summary
If I was to present just one single main takeaway from this post it would be that signals sampled on a grid can represent frequencies that also correspond to a grid. This means that elements of the image (signals) corresponding to diagonal frequencies will behave differently than horizontal / vertical ones.
This perspective is very important when designing reconstruction filters (separable!), anti-aliasing patterns or looking at mixed resolution rendering.
Second takeaway is less theoretical, more about practice: it is very useful to look at some standardized, all-frequency patterns instead of eye-balling content (especially under some animation / rendering camera). They can be animated as well, but this way you can immediately see effects of choices like anti-aliasing patterns, post-processing techniques etc. on your image. It’s not a replacement for testing and evaluating on real content, but a good starting point and one that might build better intuition and conjunctions why some technique might be better than the other one.

The reason for the odd sample positions of the MSAA grid is that this way, you get better resolution for perfectly horizontal and vertical features when using a box filter: There a four different X and Y sample coordinates per pixel, while with 45-degree rotation, you would get at most three. In other words, it’s not a rotation, but a solution to the 4-rooks problem.
Thanks for the explanation. To make sure I understand it fully: so it compromises some specific directions of frequency responses to get better *phase* coverage in principal axes and less “beating”?
N-rooks looks better than 45 degree rotated when you have lots of straight X/Y lines, such as walls/staircases/buildings, especially with box filter. Aligned lines are a common case in games as the camera up vector tends to be locked. When the building edge moves slowly across the pixel in X direction, you get four different blending values with N-rook pattern, while 45 deg rotated grid gives you only 3, and the middle one has 2x weight as the samples overlap.
DirectX sampling pattern is as close to 45 degree rotation as you can get, while maintaining even spacing between the samples in both X and Y axis. It is a pretty good compromise for the worst case visible aliasing problem, which is straight lines slightly off X or Y axis.
Sebastian, great explanation, thanks! I will add this info to the post. 🙂
Pingback: Computing gradients on grids – forward, central, and… diagonal differences | Bart Wronski