Hi, minor update to my C#/.NET graphics rendering framework / playground got just submitted to GitHub. I implemented following new features:
Surface debugging snapshots
One of commentators asked me how to easily display for debug SSAO buffer – I had no easy answer (except for hacking shaders). I realized that very often debugging requires displaying various buffers that can change / get overwritten in time – we cannot rely simply on grabbing such surface at the end of the frame for display…
Therefore I added option to create in code various surface “snapshots” that get copied to a debug buffer if needed. They are copied at given time only if user requested such copy. You can display RGB, A or fractional values (useful for depth / world position display). In future there could be some options for linearization / sRGB, range stretching clamping etc., but for now I didn’t need it. 🙂
Its use is trivial – in code after rendering information that you possibly could want debugged – like SSAO and its blurs, write:
// Adding SSAO debug
SurfaceDebugManager.RegisterDebug(context, "SSAOMain", ssaoCurrent);

// Do SSAO H blurring (...)

// Adding SSAO after H blur debug
SurfaceDebugManager.RegisterDebug(context, "SSAOBlurH", tempBlurBuffer);

// Adding SSAO after V blur debug
SurfaceDebugManager.RegisterDebug(context, "SSAOBlurV", tempBlurBuffer);
No additional shader code is needed and debug display is handled on “program” level. Passes get automatically registered and UI refreshed.
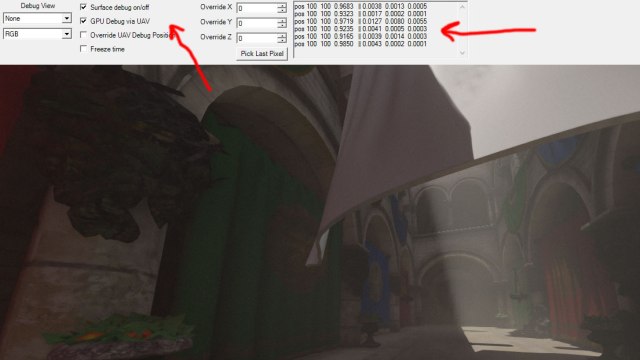
GPU debugging using UAVs
Very often when writing complex shader code (especially compute shaders) we would like to have some “printf” / debugging options. There are many tools for shader debugging that (I personally recommend excellent and open-source RenderDoc), but often launching external tools adds time overhead and it can be not possible to debug everything in case of complex compute shaders.
We would like to have “printf” like functionality form the GPU. While no APIs provide it, we can use append buffers UAVs and simply hack it in shaders and later either display such values on screen or lock/read them on the CPU. This is not a new idea.
I implemented very rough and basic functionality in the playground and made it work for both Pixel Shaders and Compute Shaders.
It doesn’t require any regular code changes, just shader file change + checking option in UI to ON.
In pixel shader one would write something like:
float3 lighting = finalLight.diffuse * albedo + finalLight.specular;

if (DEBUG_FILTER_VPOS(i.position, 100, 100))
{
 DebugInfo(i.position.xyz, lighting);
}
In compute shader you would write accordingly:
float4 finalOutValue = float4(lighting * scattering, scattering + absorbtion);

if (DEBUG_FILTER_TID(dispatchThreadID, 10, 10, 10))
{
 DebugInfo(dispatchThreadID, finalOutValue);
}
If you don’t want to specify / filter values manually in shader you don’t have to – you can override position filter in UI and use DEBUG_FILTER_CHECK_FORCE_VPOS and DEBUG_FILTER_CHECK_FORCE_TID macros instead.
If you want to debug pixels you can even automatically set those filter values in UI from last viewport click position (hacked, returns coords only in full resolution, but can be useful when trying to track negative values / NaN sources).
Minor / other
- Improved a bit temporal AA based on luma clamping only – loosely inspired by excellent Brian Karis UE4 Siggraph AA talk. 🙂
- Added small dithering / noise to the final image – I quite like this subtle effect.
- Extracted global / program constant buffer – very minor, but could help reorganizing code in the future.
- Option to freeze the time – useful for debugging / comparison screenshots.


Beautiful work, keep it up 🙂 Was there a main reason you chose SlimDX over SharpDX?
Thanks! 🙂 I have quite big CL waiting and will submit around next week, extending debugging options + taking PBR more seriously. 🙂
For the SlimDX vs SharpDX I had some reasons when I evaluated both solutions – but it was quite long time ago, ~2years? Since then SharpDX evolved a lot and become quite good and mature – I believe that at the moment SharpDX makes much sense. When DX 11.2/12 will become available I will probably switch to it.
Cool, can’t wait 🙂
I hope you dont mind, I just ported what was on github to use sharpdx already. If you want to go in that direction at some point, you could use this as a start.
https://github.com/PlehXP/CSharpRenderer/tree/sharpdx
I don’t mind at all, that’s super cool, thanks! 🙂